Isabel's Project Home Page
This is where I post short write-ups explaining the projects I'm working on.
Unsolved Homicide Data Analysis
This is the probably the last post in a series of posts about my collection, cleaning, and analysis of Unsolved Homicide data for the Cincinnati area. In the last post, I left off after briefly describing some of the cleaning I preformed on the data and described some of the data I added. Using this mostly clean data I created a few charts to demonstrate some of the trends in the data.
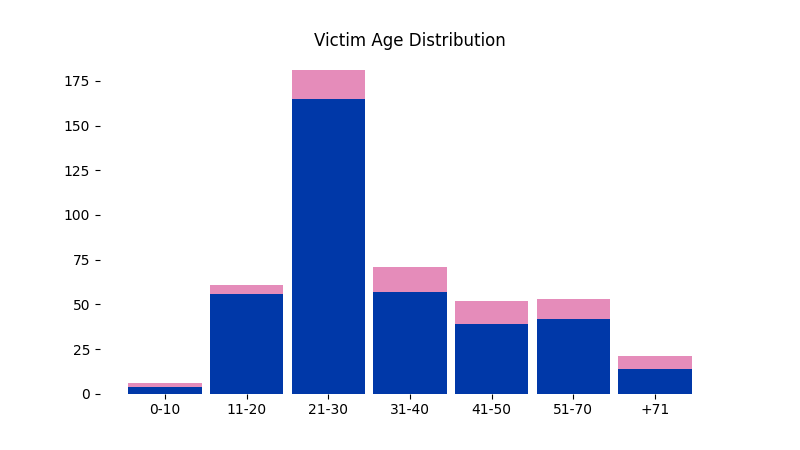
The age distribution of the deceased had some surprises. I had heard that young people are more likely to be murdered than people in older age brackets but it was still interesting to see in this data. It was also very strange to me that so many very young people were likely to be murdered. Boys 11-20 were essentially as likely to be murdered as men 31-40. And then there were the extremely young. The number of children under 10 and more infants than I care to remember. It is absolutely heart breaking.

I’m not sure what needs to be done to prevent such young people from being murdered but clearly we aren’t doing it.
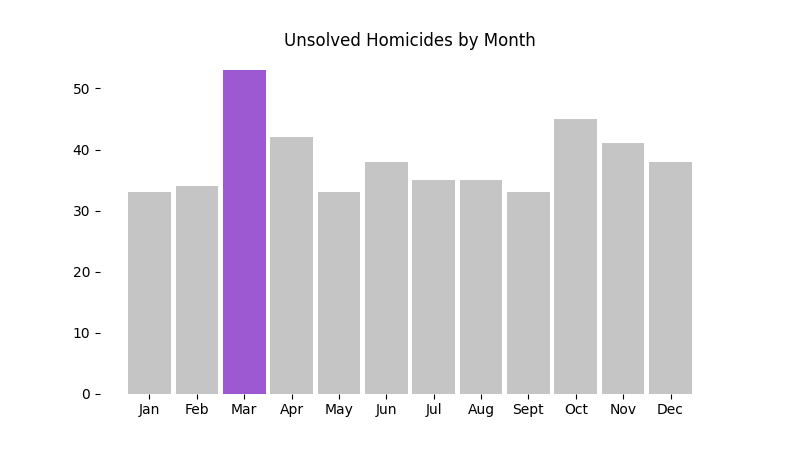
So we’ve looked a little bit at the breakdown of homicide cases by victim age but what about some other trends that might be a bit more odd. The dataset contains the date of each homicide (where a range was presented the initial date was presumed to be the homicide date). What’s the deadliest month in Cincinnati?

It turns out that March is the deadliest month. Is this a spurious correlation or is there something to this? I’m not entirely sure. I could see it being either. March in Cincinnati is a bit unpredictable, it could be 75 and sunny or it could be 15 and snowing. Does the likelihood of precipitation affect evidence that can be collected? Is it because there are fewer people out to be witnesses? Or is it because there’s the weather is ‘just right’? It’s warm enough to be outside but cold enough to only be out for a purpose. There are other trends, such as with heatwaves, are known to increase violent crime and social aggression. Does March represent the same thing but in reverse? This might be interesting to try to correlate in other cities throughout the midwest and places that get 4 seasons.
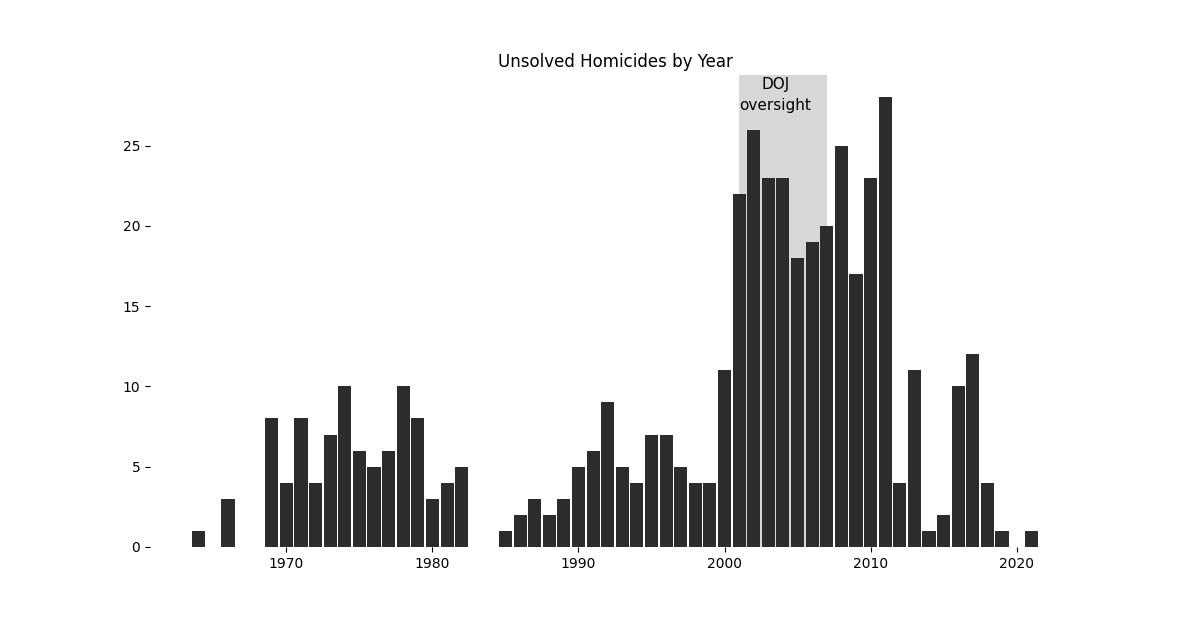
Since this is time series data, I was curious what it all looked like.

What we see is that most of the unsolved cases have occurred in the past 20 years or so. I guess I was going in expecting that there would be more unsolved cases the further back in history we looked. I based this on a general perception that forensics and investigative techniques have changed and improved as the decades passed. This doesn’t seem to be the case though. If we look at annual homicides over roughly the same period we see the same general shape. Which is to be expected but it’s still reassuring to see the patterns present across related data.

This chart prepared by the Cincinnati Enquirer shows that part of the reason behind more unsolved cases in the last 20 years than in the 50’s-90’s is due to an increase in homicides. Particularly we see a jump as we enter the 2000’s. Why this happens is beyond the aims of this analysis but it’s important to note the general trend. It’s also important to note, figure 3, that from 2001-2007 the Cincinnati Police Department was taking part in a Memorandum of Agreement with the US Department of Justice. This agreement was entered following the riots sparked by the killings of Roger Owensby, Jr. from asphyxiation, the shooting of unarmed 19-year-old Timothy Thomas, and years of discriminatory policing by the department. Over this whole 20 year time period from 2001 - 2021 we see significant economic strain along with social strain from riots, terrorism, war, and now a global pandemic. While I don’t intend to try to explain the increase of homicides I feel like it’s worth reminding people of these factors.
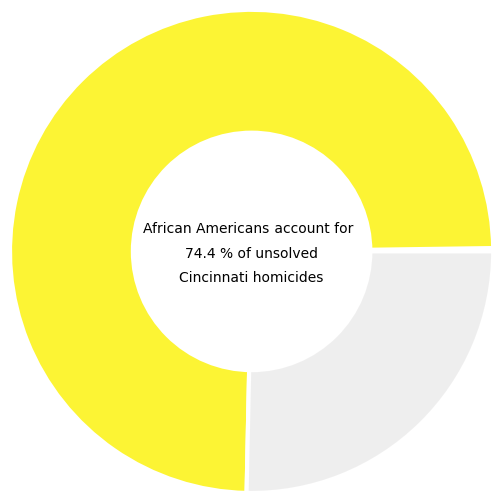
After looking at the correlation between fig 3 and fig 4 and noting some of the local history, does race impact the cases?

I haven’t been able to look at all of the homicide data yet so I don’t know if this mirrors the number of total homicides. I can say that according to the census the demographics of Cincinnati are as follows:
	White alone 50.3%
	Black or African American alone 41.4%
	American Indian and Alaska Native alone  0.1%,
	Asian alone, percent 2.2%
	Native Hawaiian and Other Pacific Islander alone 0.1%
	Two or More Races 4.6%
	Hispanic or Latino 4.2%
Based on this data, African Americans are over represented in unsolved homicide cases.
Mapping the data
When I was first starting out with this project I knew I wanted to show the spatial relationship of these homicides. I used the folium library which is based on leaf.js (so make sure your script blockers let it through). The interactive map below should let you zoom and pan across the city. If you click on a marker you should be presented with the case number and some of the details of the case. The color of each case is a reflection of it’s proximity to the present. The further back in time the case is the fainter the color, the more intense the color the more recently the person was murdered. Lastly, if you happen to have information relevant to one of the cases please contact the Ohio Bureau of Criminal Investigation
Content Notice: The information contained in these markers are homicide case notes, some of the material may not be suitable for all readers and may contain disturbing descriptions of violence.
Leaflet.JS
Leaflet.JS would not exist were it not for the hard work of Volodymyr Agafonkin . Volodymyr is a Ukrainian citizen who has been displaced by the war and devastation brought on by the Russian invasion of Ukraine. Please consider contributing to one of the organizations helping those affected by the war. Stand With Ukraine and Come Back Alive have been suggested by the Leaflet.JS team.